
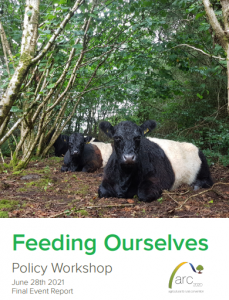
 Here we publish a short extract on farm diversification from the recent Feeding Ourselves Policy Document. In this piece, Matteo Metta widens the focus of farm diversification, while also addressing some blind spots on data gaps and value adding. For more from Matteo and many others, go to the full report, available below.
Diversification is…?
From a socio-economic perspective, farmers’ livelihoods can rely on the selling of agricultural production, public subsidies and payments, on-farm diversification activities, and off-farm incomes. Although on-farm diversification is neither risk-free, nor a silver bullet solution, it can move Irish agriculture away from the current productivist path, which is increasing farmers’ dependency on supply chain actors (financial providers, trade intermediators, manufactures) or public subsidies (Pillar I and II’s per-hectare payments).
Up-to-date statistics on farm diversification (other gainful activities related to the agricultural holding) in Ireland broken down at NUTS-2 or lower levels are not available in EUROSTAT. The Farm Structure Survey 2010 reports that 9.2% of agricultural holdings in Ireland were engaged in other gainful activities across the country, against an average of around 13% across the 27 Member States. This share was stable in Ireland between 2013 and 2016.
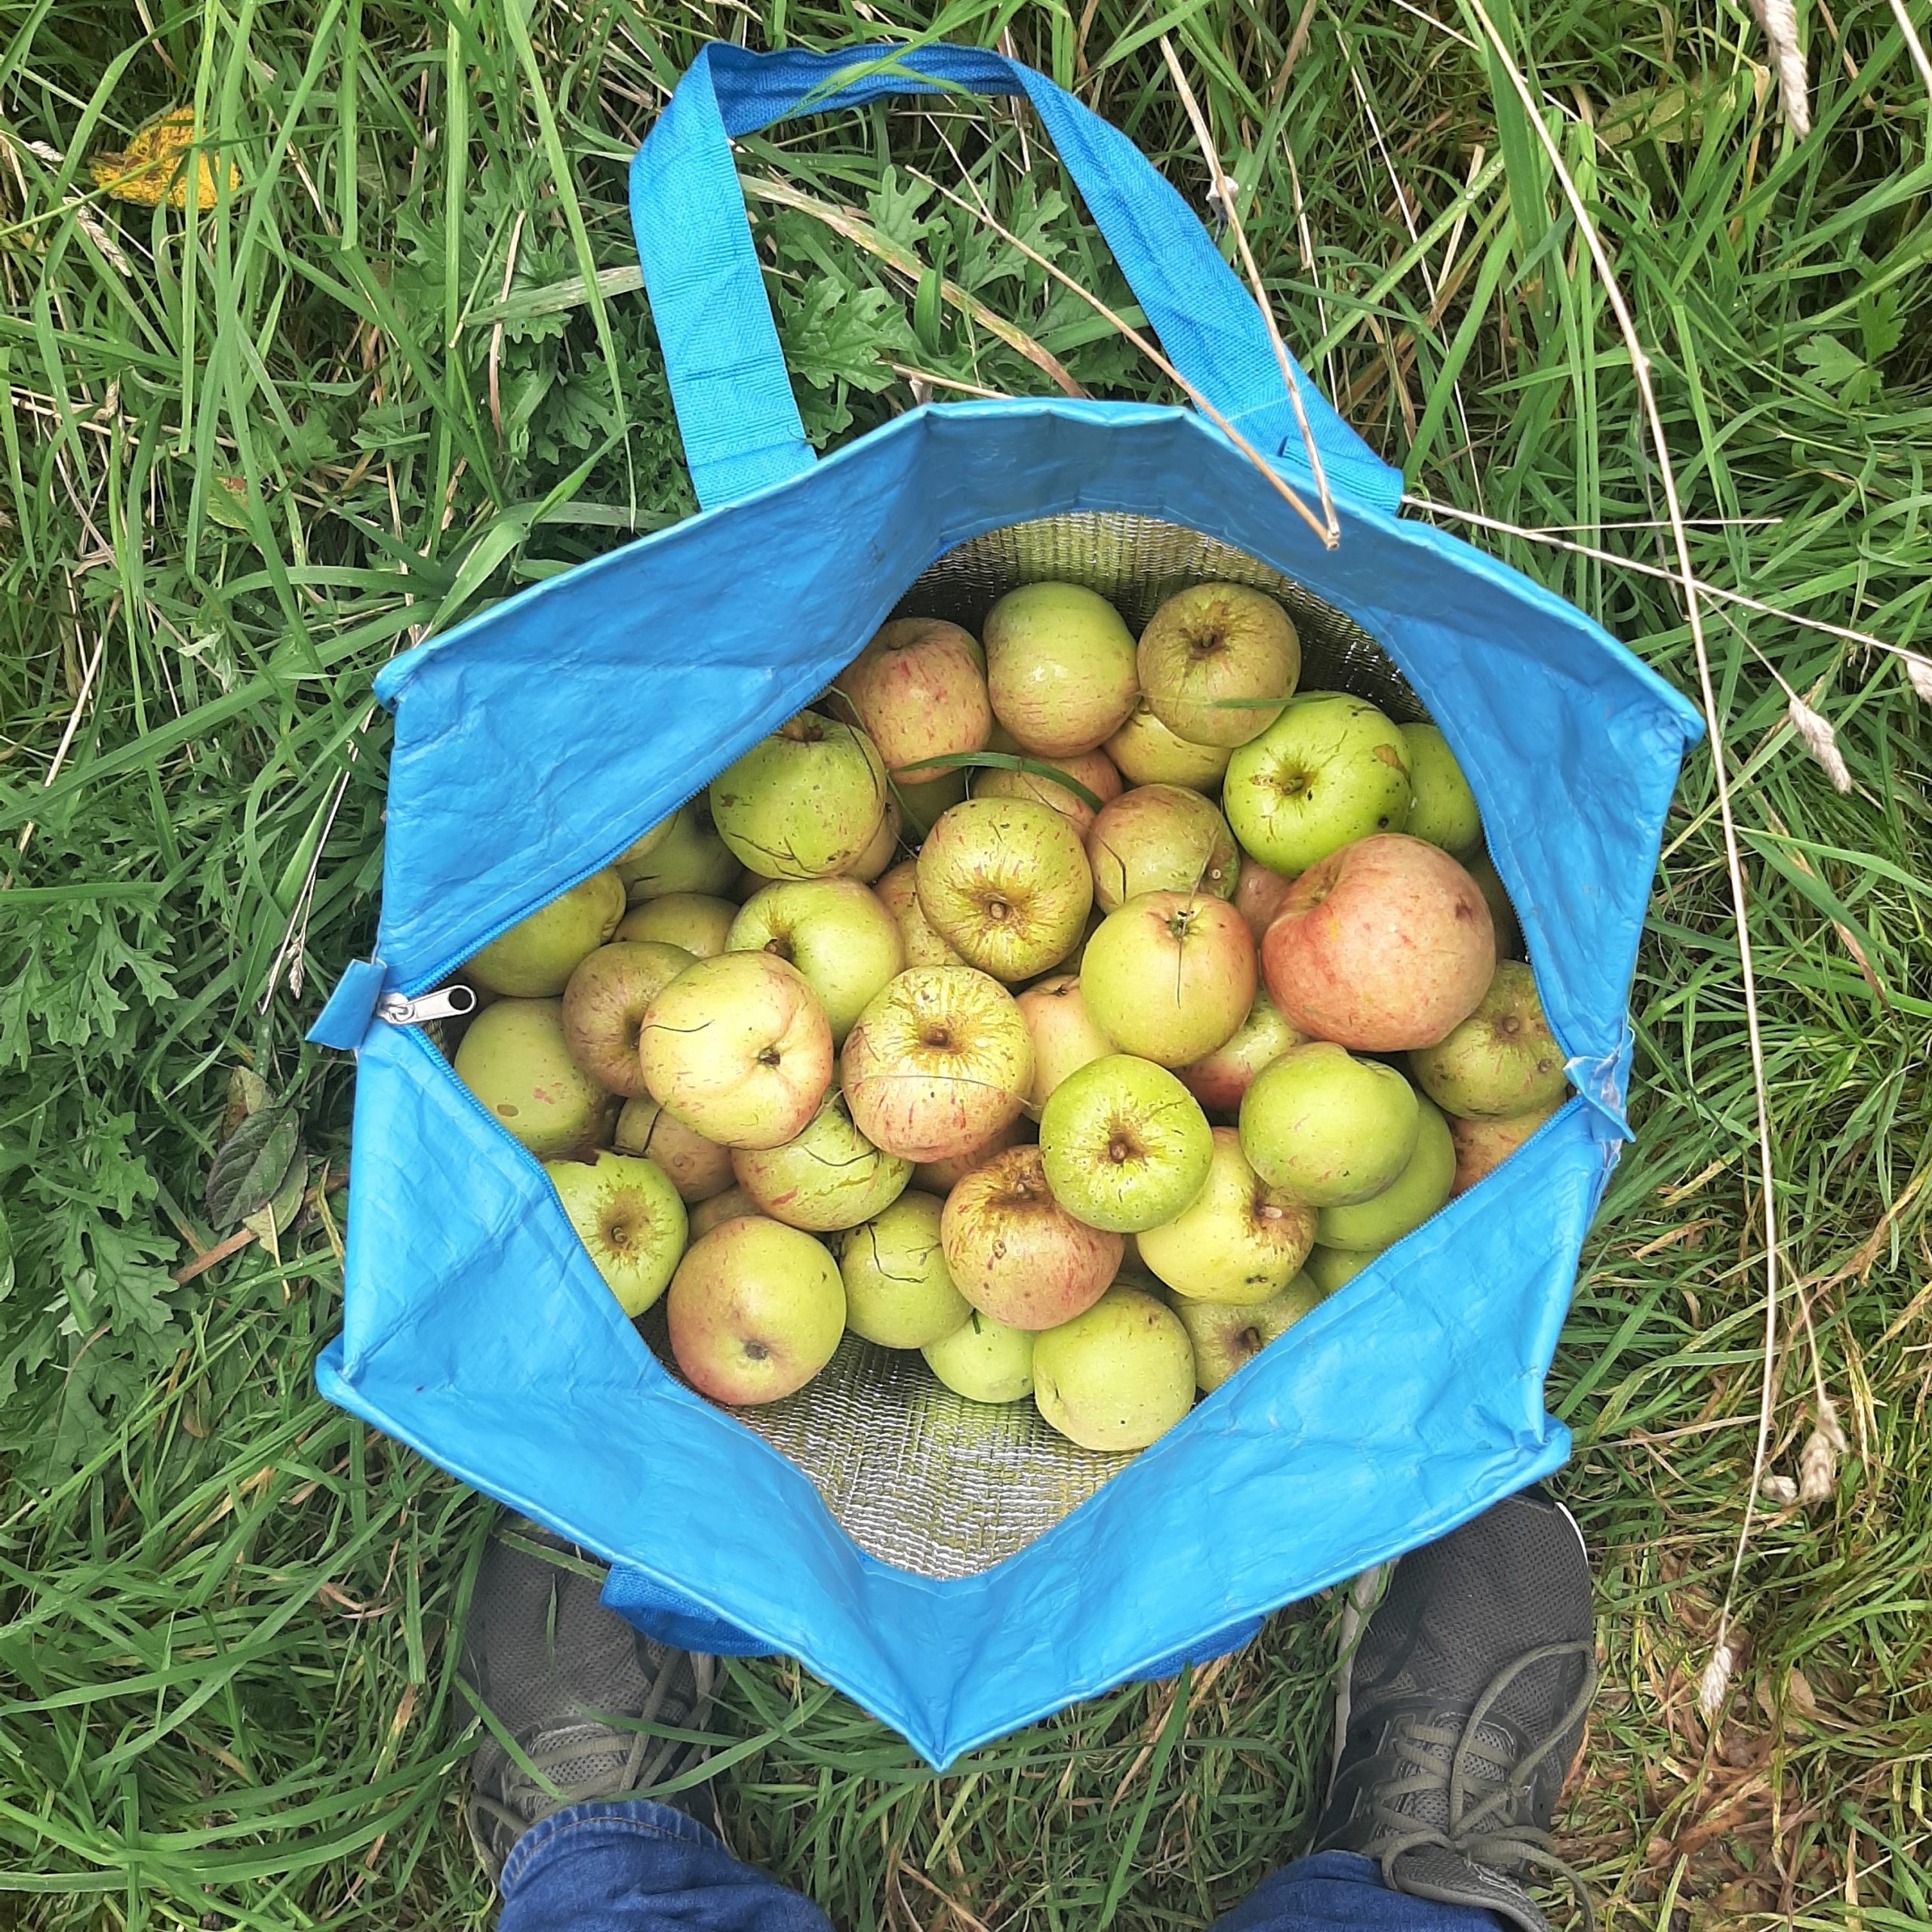
The main on-farm diversification activities performed in Ireland are forestry work, contractual work (using holding equipment to help other farms, landscape maintenance, agricultural and environmental services) and agri-tourism.
The number of farms who are engaged in processing of farm products is very low.
Three economic considerations
Besides the importance of integrating agriculture with the society and environment, there are three economic considerations worth exploring for the sustainability of farmers livelihoods in Ireland:
- How much value added are farm diversification’s gainful activities bringing to the farmers’ income?
Unfortunately, update statistics are not available on EUROSTAT. More research in national statistics may be needed not only to describe the existing situation and long-term trends, but also to find out room for improvements and create an enabling environment to farm diversification.
- How much of agri-environmental payments under CAP Pillar II account for the farmers’ income, vis-à-vis the direct payments under Pillar I?
Numerous public subsidies and payments are currently available for farmers and their aggregation can be a significant source of income (inequalities?). A unique beneficiary code – as is used in other EU countries and policies – would help to understand the aggregate sum of public support received by each farmer, thus creating an informed dialogue among various stakeholders, and improve the targeting and fairness of CAP support across the Irish territory.
- How much value added is captured by Irish farmers along the food value chain if they rely only on agricultural production?
Irish farmers only capture less than 20% of the value added in the food chain (i.e. 18.1% in 2016). This is definitely low in absolute terms, but also below the long-term EU average of roughly 25%.
It is Ireland’s food and drink manufacturers who capture the largest share and this share grew between 2008 and 2015. There is a need to reverse this unfair value distribution and for more actors to move together in this transition towards a food supply chain with more wins for farmers.
More on Feeding Ourselves
1 Trackback / Pingback
Comments are closed.